
Sometimes I wonder how it was that Cassandra, the Trojan prophetess, had so much trouble in convincing her fellow Trojan citizen that it was not such a good idea to demolish the city walls to let in that big, wooden horse. Maybe she spoke in riddles and using obscure language, as fitting for a prophetess. But in our case, facing global warming and resource depletion, I believe that it is fundamental today to arrange our knowledge in ways that can be understood by citizens and decision makers. Otherwise, all the work we have done will be lost and we'll remain just Cassandras.
In 1992, William Nordhaus wrote an article (1) where he strongly criticized "The Limits to Growth" (LTG) study. Referring to the 1972 version of LTG, he said that,
"....it seems apparent that the dynamic behavior of the enormously complicated Limits I model was not fully understood (or even understandable) by anyone, either authors or critics."
Which we may take as correct at least in one respect; that is, if Nordhaus meant to include himself among these "critics". Indeed, with this sentence, Nordhaus may have been admitting that his 1973 paper (2), where he had even more strongly criticized world modelling, was completely wrong. Simply, in 1973 he hadn't understood how the model worked, and not even in 1992. (I discuss in detail these papers by Nordhaus in my book "LTG Revisited" (3).)
It is also true that the large majority of those who criticized the first LTG study after its publication, in 1972, did so without really understanding world modelling. But is it true that the "world3" model at the basis of the study was not "understandable," as Nordhaus maintains? Possibly, Nordhaus had based his evaluation on this graph:
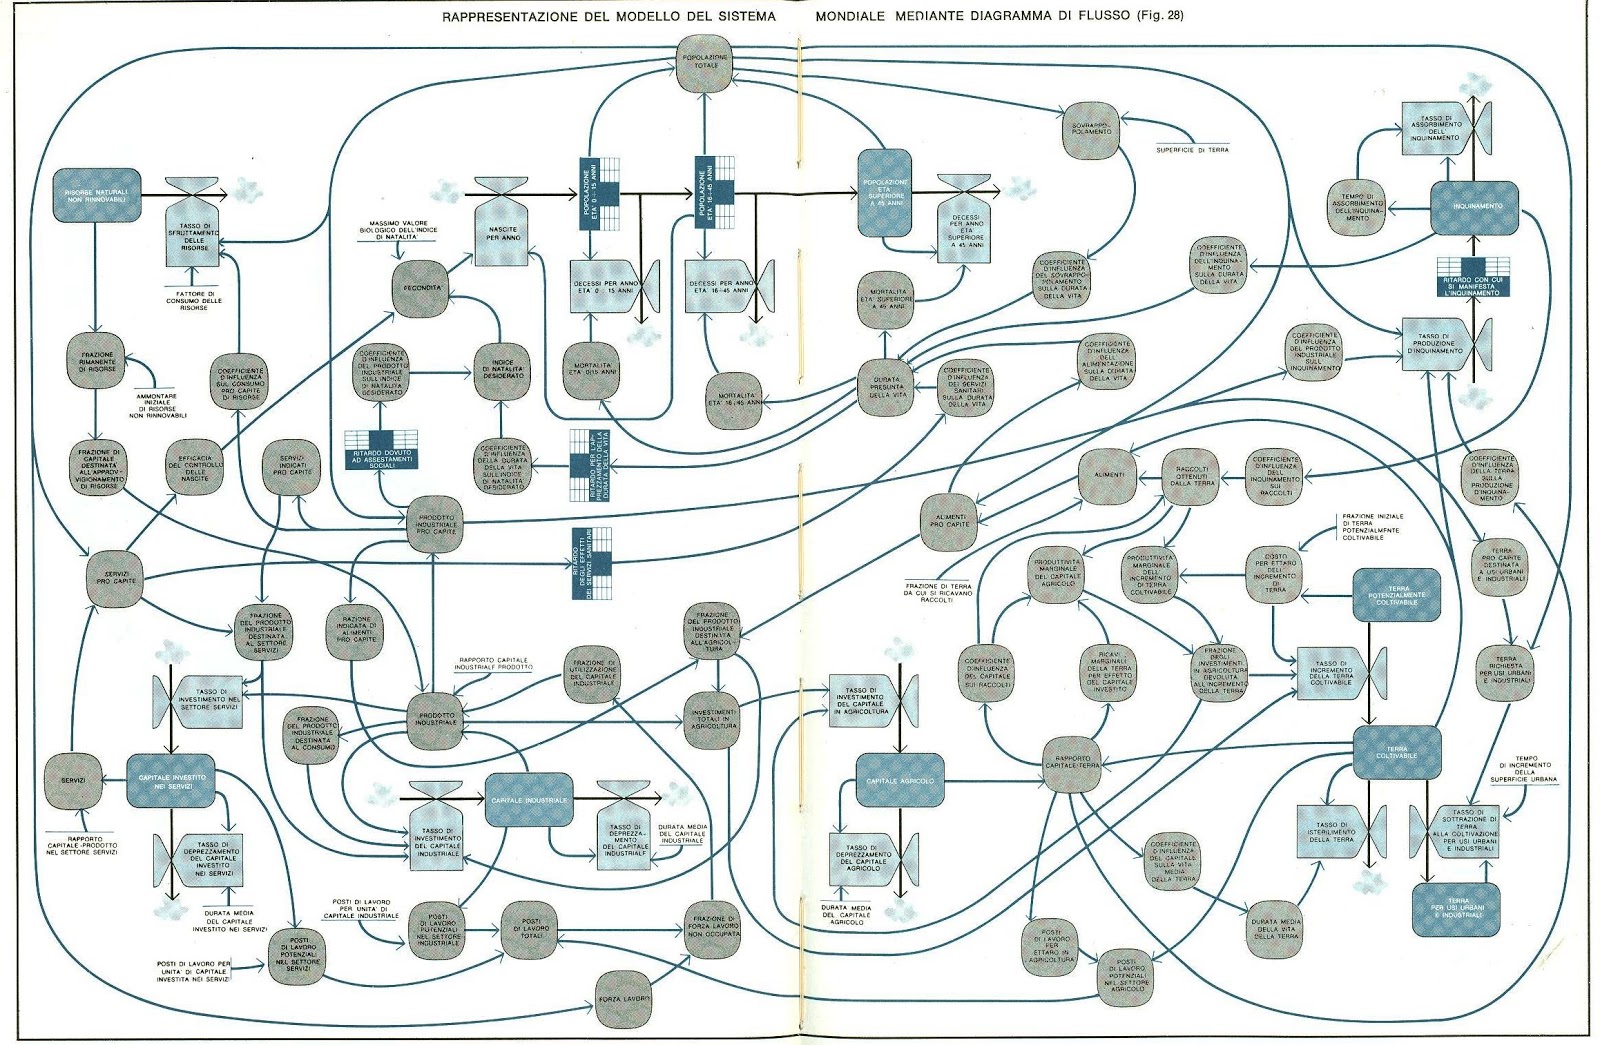
This is a scan of the graphical representation of the world3 model taken from my personal copy of the 1972 edition of LTG. The boxes are labelled in Italian but, either in English or in Italian, the logic of the model is very difficult to grasp. It appears just as a random collection of boxes and arrows, not unlike the plan of the subway of a major city. What you have here, indeed, is an example of a "spaghetti model", a typical bane of system dynamics (SD) models (as discussed, for instance, by Jacques Lefevre). It is possible that it is this complex and apparently haphazard scheme that confused LTG critics and supporters alike. It may have been one the reasons of the flood of criticism that accused the LTG study of being based on arbitrary assumptions, if not a hoax purposefully designed to trick the public. People just could't believe that the mass of spaghetti shown in the figure could generate to a cycle of growth and decline and that this cycle was to be the destiny of our economy.

But the world3 model was not arbitrary. As one of the first models of this kind in history, it is not surprising that its graphic representation left something to be desired. That didn't affect the performance of the model, which withstood very well the test of time. The real world parameters, so far, have behaved close to the results of the "base case" scenario of the 1972 LTG study, as Turner shows. Critics had to work hard to find weak points in the study that went beyond simple statements of disbelief, as I discussed in a post of mine. In the end, they had to settle on very minor points that had no relevance to the significance of the study.
The LTG model was not impossible to understand, either. If you look at the text of the original 1972 LTG book, you'll see that the figure shown above came only after several pages that described in detail how the model worked. The authors made a thorough job in showing diagrams of the various subsets of the model. That made the model understandable even by economists.
Unfortunately, that was not enough. No matter how well the model was explained, understanding LTG required an effort that most people were not willing to expend. It is difficult to fight against the human tendency of disbelieving bad news - the Cassandra effect, in short.
But we can learn something from the LTG experience. A fundamental point is related to the public perception of models. For a scientist, the need for models is obvious; but it is not so for a politician or for the public. In this sense, world modelling and modern Climate Science have the same problem. Both fields are seen as based on complex models that are beyond the capability of understanding of the non-specialist. So, what is exactly the role of models in the public debate on the issues of climate change and resource depletion?
Sometimes, people seem to believe in models just because they are complex. Otherwise they see complexity as proof that the model is wrong or irrelevant. The problem of complex models is that they leave people free to chose one or the other attitude, depending on their feelings or their political ideas. So, I think we badly need to frame our models in "mind sized bites" of knowledge - as suggested by Seymour Papert - that people can grasp.
As an example, here is how Magne Myrveit has represented the five main stocks of "The Limits to Growth" model (from a paper titled "The World Model Controversy").

This figure can be criticized as an oversimplification, but it is a huge step forward in the sense that it gives an immediate visual idea of what the main elements of the models are. Yet, it has a problem. "Mind sized" doesn't just mean reducing the number of elements in the model. It means, in my opinion, providing also a clue on what makes the model tick. In other words, a representation such as this one, simple as it is, still suffers from the spaghetti syndrome. It is static; it doesn't tell you anything on where the system is going. And, yet, the results of the calculations clearly show that the system is going somewhere; it is undergoing a cycle of growth and decline. That is not clear at all from this figure.
So, I think that if we want to make useful mind sized models we must clarify that there is a tendency; a force, the result of something that in technical terms is called a "potential". Potentials generate forces, and forces move things along. I think this is the point that Jacques Lefevre was doing when he used the metaphor of chemical reactions for describing system dynamics models. But there is an even simpler metaphor: "bathub dynamics" as discussed by John Sterman and Linda Sweeney.

Now, this is a real mind sized model, in the sense that it is clear that it is gravity (better said, the gravitational potential) that moves water in a certain direction. This representation of the model is not static, it shows what happens. It was with this example in my mind that I proposed the "three tiered fountain" image as a representation of a simple world model:

Neither a bathub nor a fountain have the characteristic that we call "feedback", which is crucial in world models as it generates non linear growth and decline. Nevertheless, these are images that clarify the fact that the system is driven by a potential. Water must go somewhere and that is because of the gravitational potential. Then, it is clear that if we start from a limited reservoir of water, then at some moment it must run out. In a world model, it is not gravity that moves things, but thermodynamic potentials, in turn related to the energy stocked in the natural resources that an economy exploits. And it should be also clear that if natural resources exist in limited amounts, they must run out at some moment. So, we can build a simple, mind sized model as:


So, I think this is a line to pursue if we want our models to be understood and, more than all, acted upon. That is true for both resource depletion and climate change, which are two sides of the same coin. But would mind sized models solve the problem of the disconnection of scientists and decision makers? Well, that won't be easy, of course. Sometimes, when playing with these models, I see myself as if I really were the ancient Cassandra, the Trojan prophetess, drawing stock and flow diagrams on the sand in front of perplexed Trojan citizens. Not easy. Yet, I think we have to try.
References
1. Lethal Models 2: The Limits to Growth Revisited, by William Nordhaus Brookings Papers on Economic Activity, Vol 1992, No. 2 (1992), pp 1-59. URL: http://www.jstor.org/stable/2534581
2. World Dynamics: Measurement Without Data,William D. Nordhaus, The Economic Journal, vol. 83, No. 332 (Dec., 1973), pp. 1156-118, http://www.jstor.org/stable/2230846
3. "The Limits to Growth Revisited" Ugo Bardi, Springer 2011
3. "The Limits to Growth Revisited" Ugo Bardi, Springer 2011